[row][column md=”3″]
Infographic, Magazine, Print Design
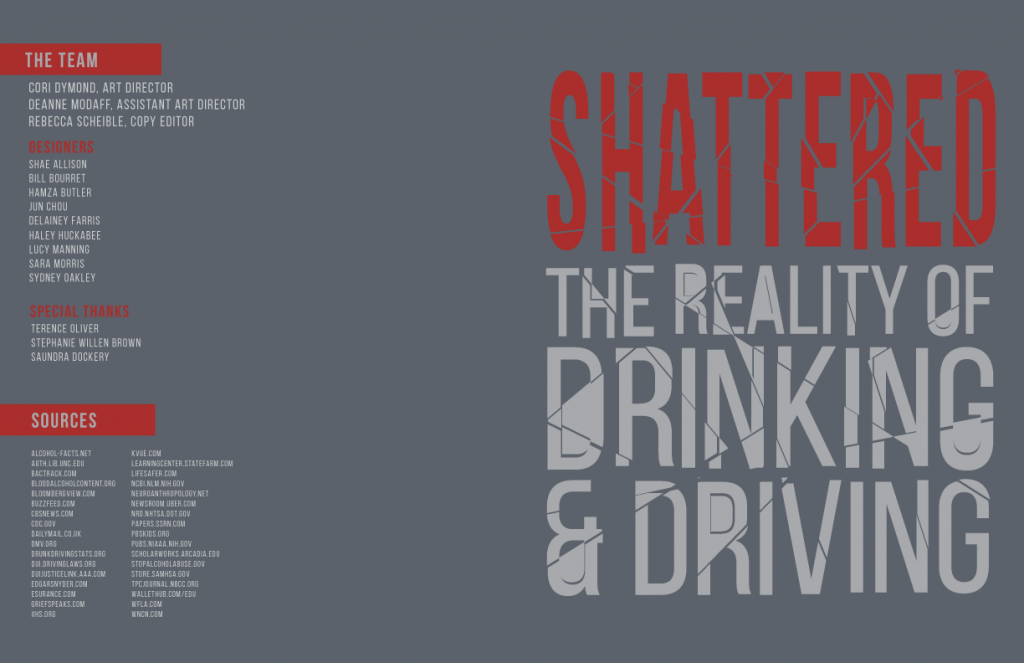
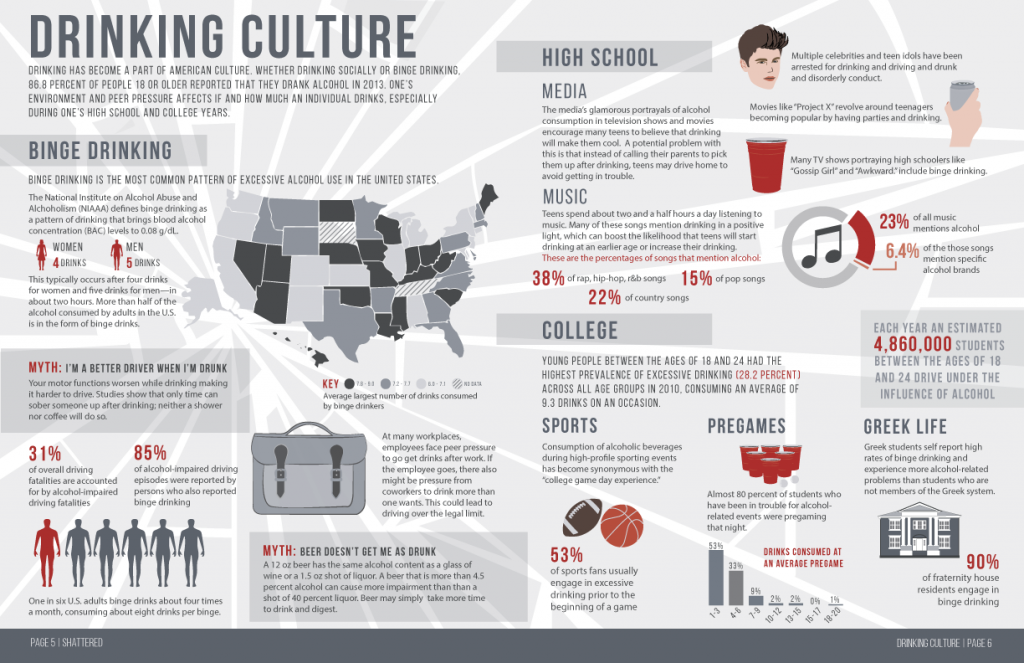
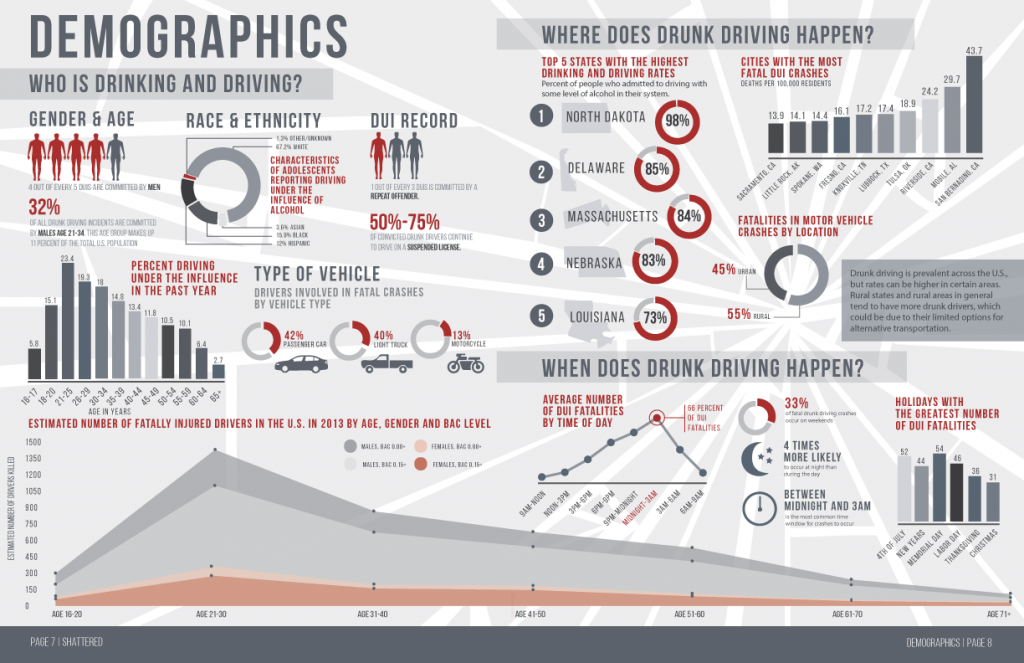
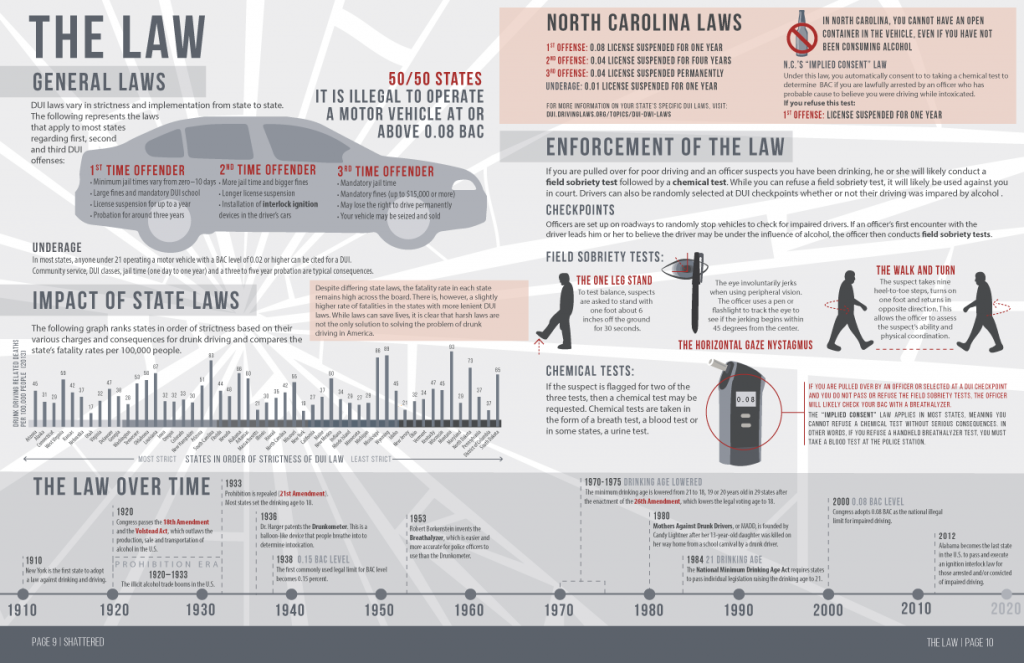
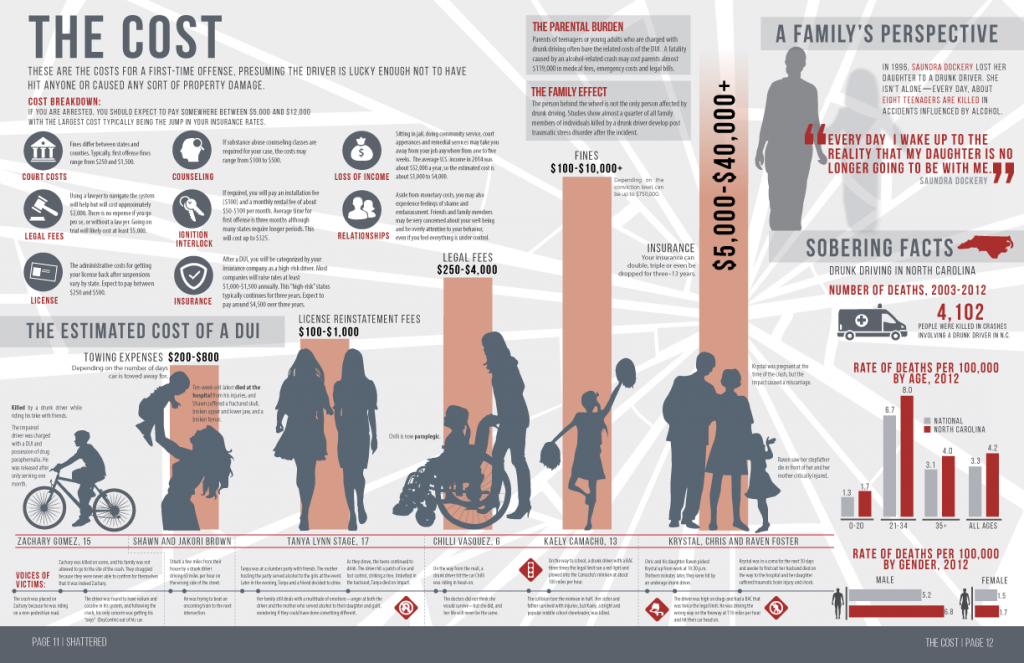
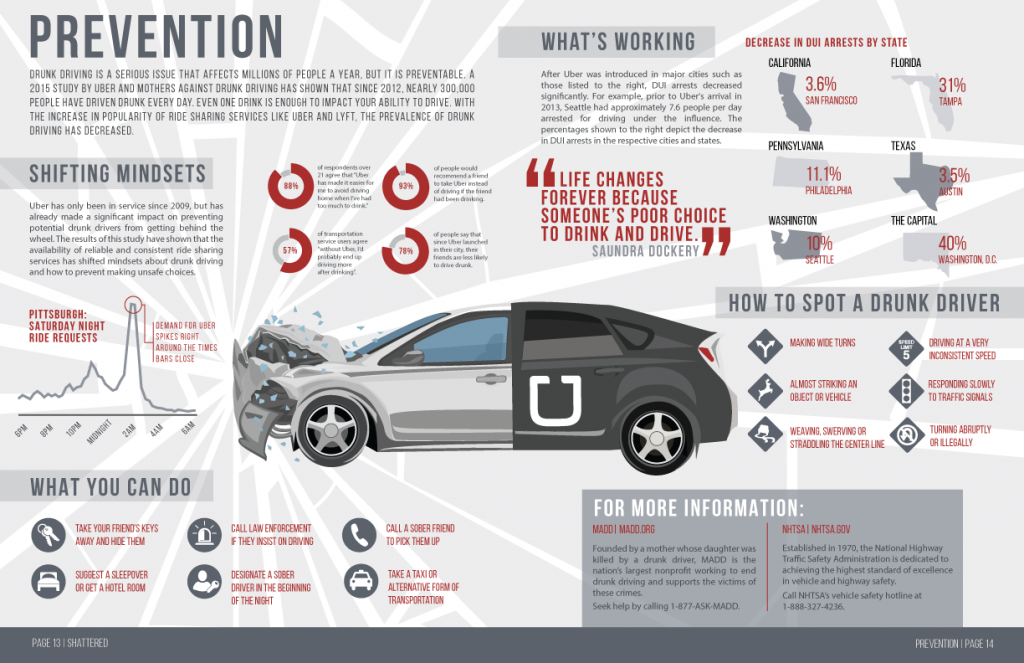
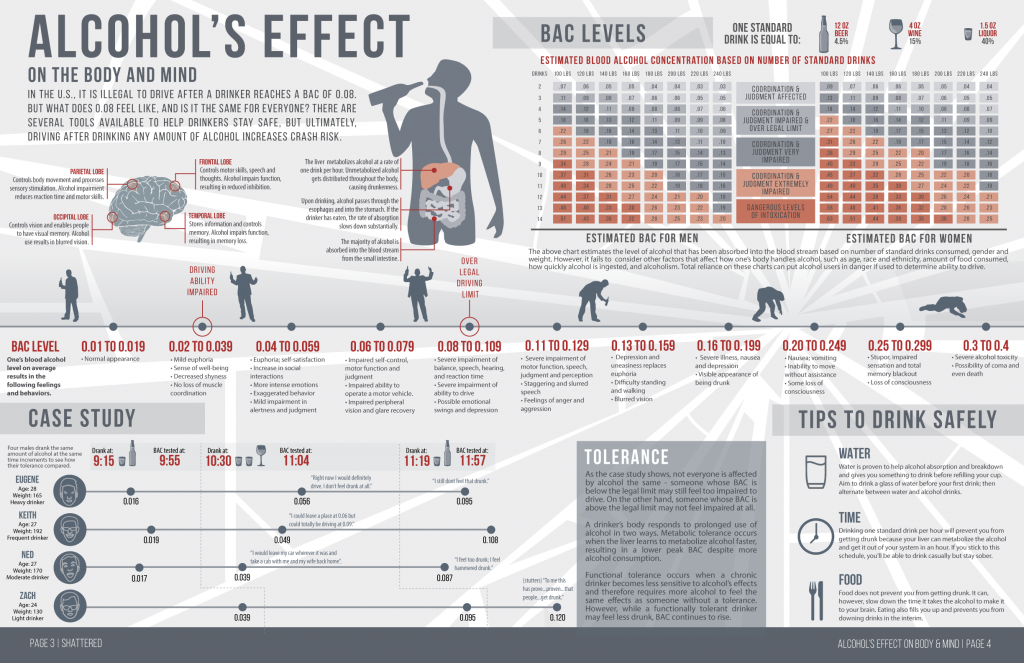
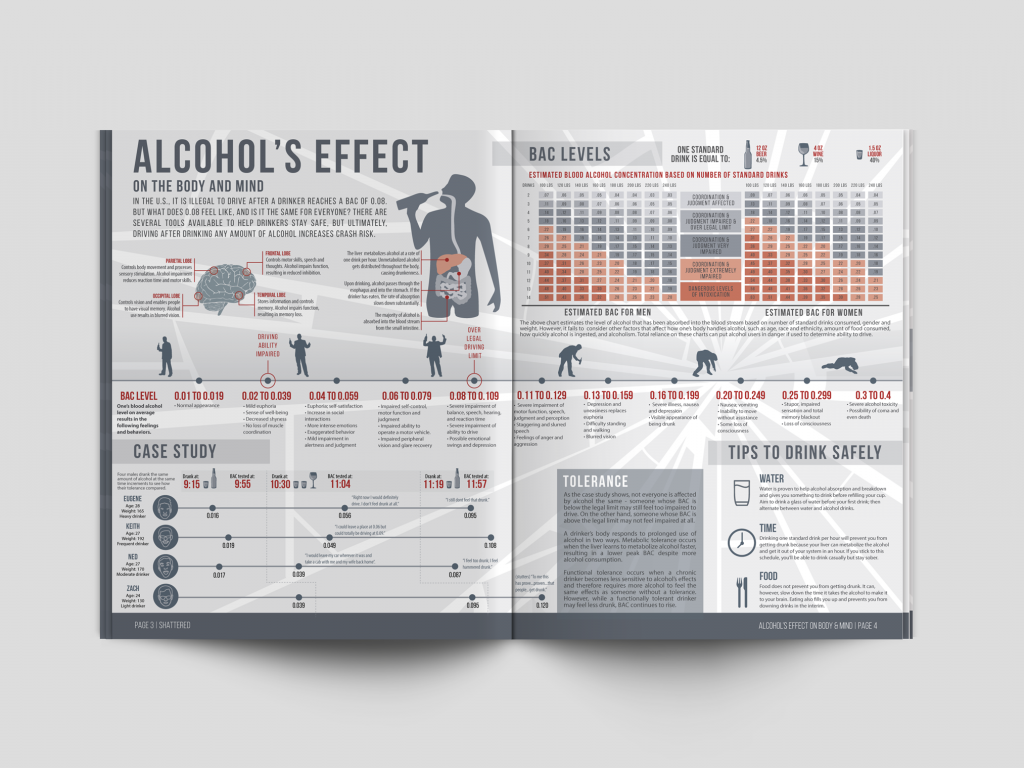
Drinking and driving is a harsh reality of today’s society. In this collaborative piece, I worked with one other student to design the first spread, which details the effect of alcohol on one’s body and mind. I was also the copy editor and analyzed the package to ensure an error-free product that aligns with AP Style.[/column][column md=”9″]
[/column][/row]
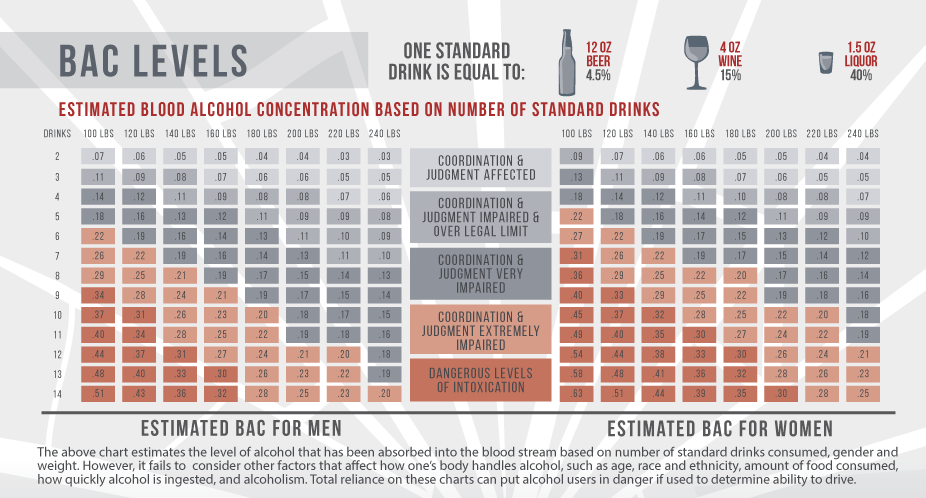
Below is a closeup of a chart I created estimating blood alcohol concentration (BAC) levels based on gender, weight and number of standard drinks consumed. An important disclaimer appears below the chart highlighting the shortfalls of relying on a BAC chart.
[row][column md=”6″ mdoff=”2″]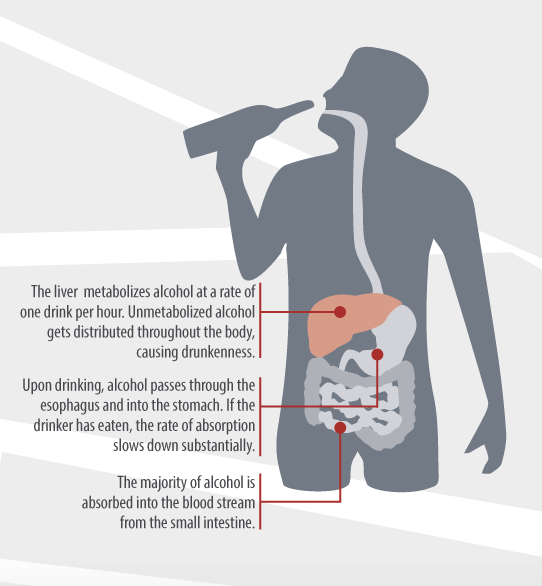 [/column]
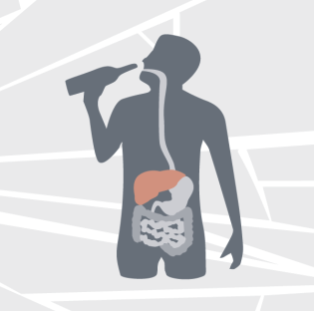
[column md=”2″]This is a closeup of a graphic I illustrated that details the human reaction to ingesting alcohol.[/column][/row]
